Microsoft Fabric: Helping Analysts Through AI-Powered Analytics
For decades, businesses have collected and saved vast amounts of data from various sources like apps, services, and Internet of Things (IoT) sensors. Each year, the amount of collected data increases at a remarkable pace.
But extracting value from this data has so far been the most challenging task.
More often than not, data is separated and not synchronized properly; Inconsistent data can result in expensive integration efforts; Low-quality data can negatively impact new AI models; and outdated reports lead to misinterpretation of insights. These challenges hinder the ability to fully utilize the potential value of data, thus impeding innovation and AI advancements.
So what has been preventing businesses from overcoming these challenges?
Statista found that in 2022, data literacy was the leading challenge for Chief Data Officers (CDOs) looking to improve data analytics at their organization. Some other common pain points include:
- Lack of actionable insights: Organizations often struggle with extracting meaningful insights from their data. They may have large volumes of data but can’t identify patterns, trends, or correlations that can drive actionable decisions.
- Inefficient data management: Managing and organizing data can be challenging for organizations, especially when dealing with large and diverse datasets.
- Data silos and integration issues: Many organizations face the problem of data silos, where data is fragmented and scattered across different systems or departments. Integrating data from multiple sources becomes challenging, hindering the ability to get a holistic view and perform a comprehensive analysis.
- Manual and time-consuming processes: Traditional manual analysis methods can be time-consuming and prone to errors.
- Inadequate data security and privacy: Data analytics involves handling sensitive and confidential information.
With many challenges impeding the efficient utilization of data analytics, what can leaders do to help their employees enhance their data literacy skills and create actionable insights?
Introducing Microsoft Fabric: Bring your data to AI
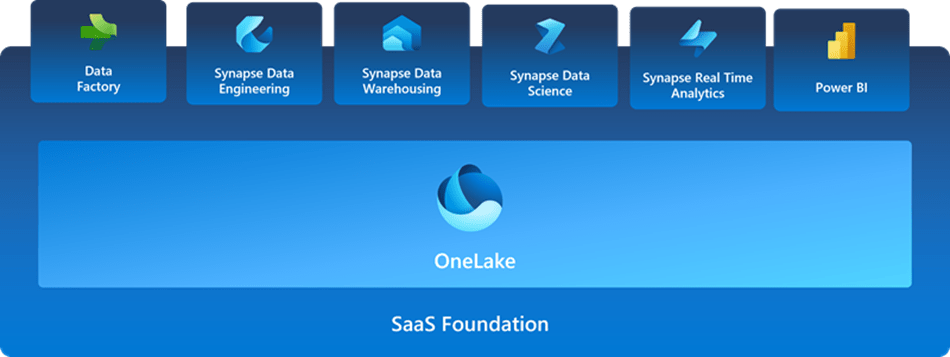
Microsoft Fabric (in preview) is a package of different services that help enterprises with data movement, real-time analytics, cost management, and more. Instead of piecing together various services from multiple vendors, you can simplify your analytics needs using an all-in-one platform.
Fabric is built on a Software as a Service (SaaS) foundation, which brings components from Power BI, Azure Synapse, and Azure Data Factory into one integrated environment. This integration provides advantages such as:
- A wide range of analytic tools that work well together
- Tools designed to help you learn easily
- Ease of access for developers
- Keeping the data where it is while using your preferred analytics tools
- Centralized administration and governance across all experiences (IT teams can centrally configure core enterprise capabilities; permissions and data sensitivity labels are automatically applied across all services and suites)
Coming soon to Fabric is the integration of Microsoft’s AI Copilot! From integrating data to writing code, finding insights, and creating reports, Copilot allows you to turn insights into action to support your daily workflow and increase productivity.
Microsoft Fabric Features
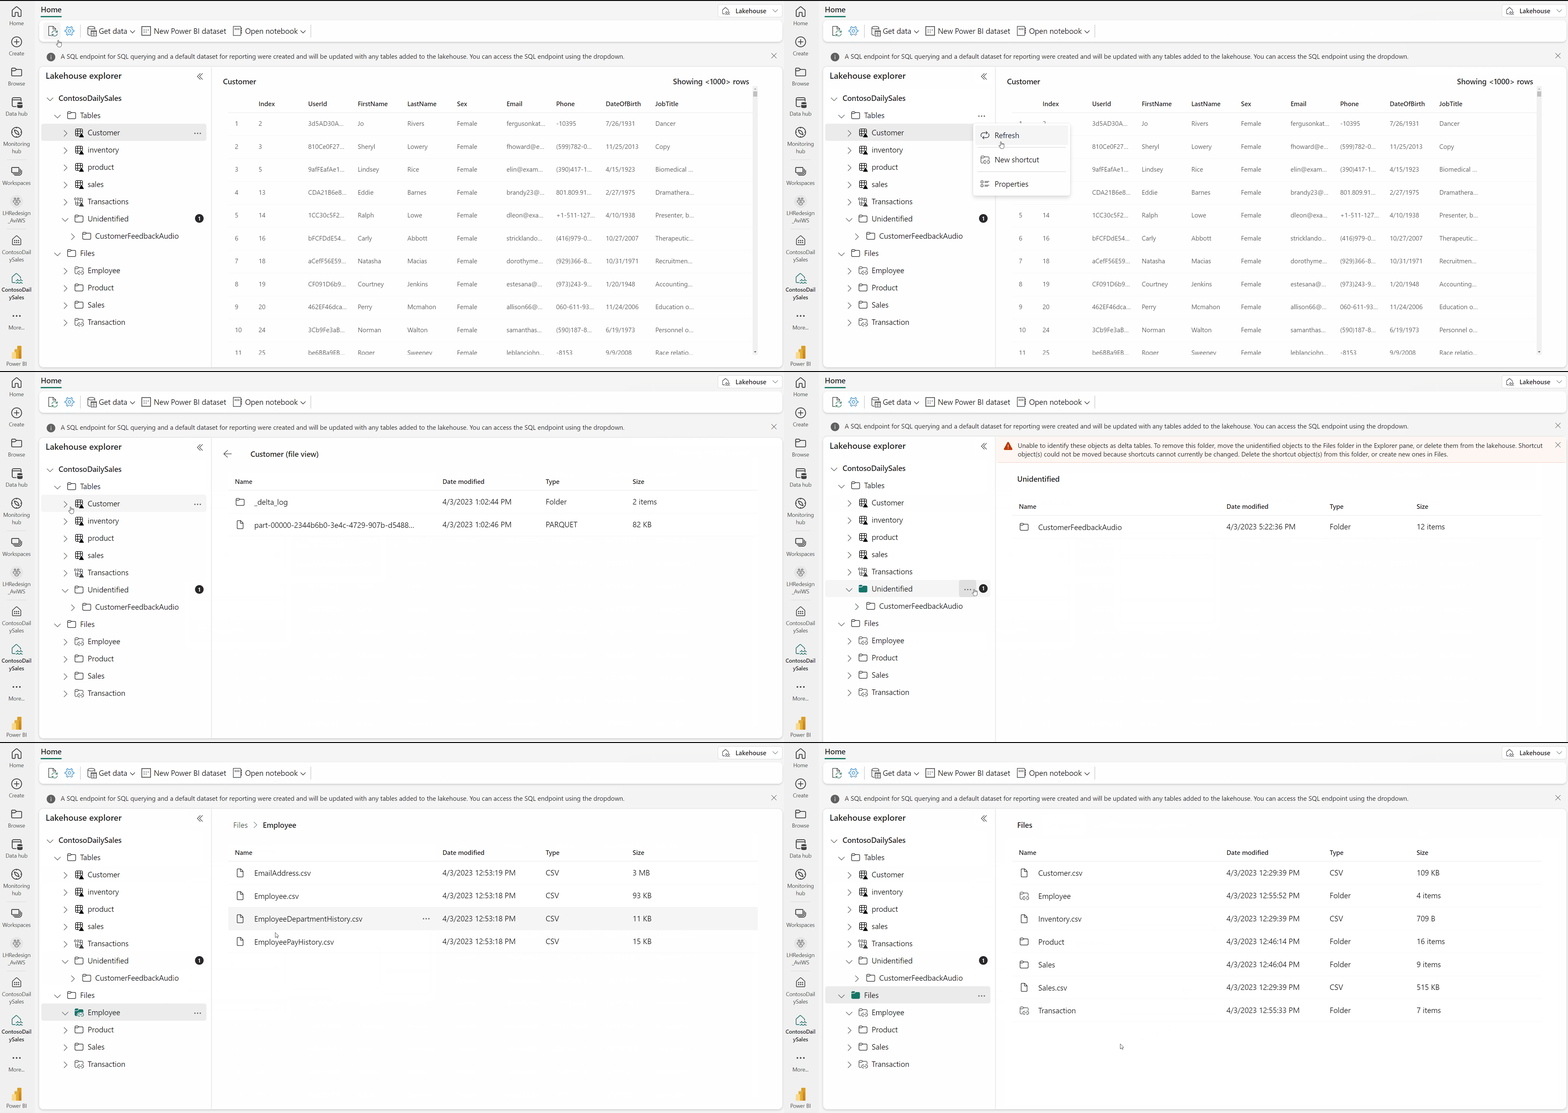
Synapse-Powered Data Engineering (in preview): enables users to design, build, and maintain infrastructures and systems that will allow your organization to collect, store, process, and analyze large volumes of data. From the data engineering homepage, you can:
- Create and manage your data using a lakehouse.
- Design pipelines to copy data into your lakehouse.
- Use Spark Job definitions to submit batch/streaming jobs to Spark cluster.
- Use notebooks to write code for data ingestion, preparation, and transformation.
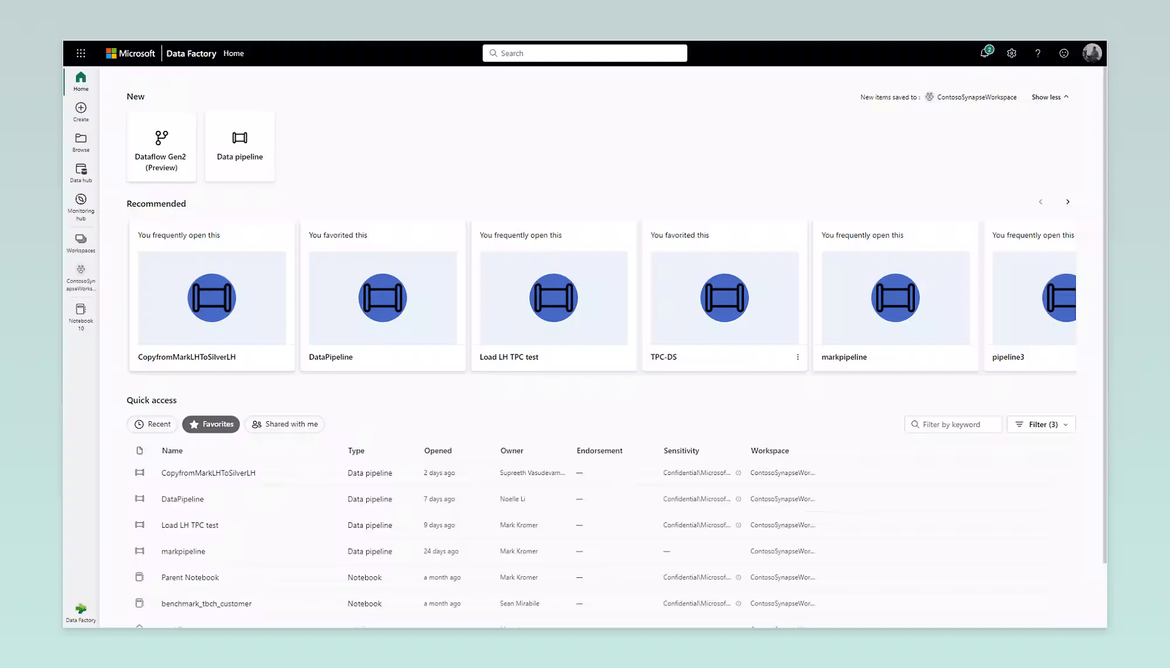
Azure Data Factory (in preview): simplifies the process of ingesting, transforming, and loading data from diverse sources such as databases, files, APIs, and cloud storage. It provides a visual interface and a range of activities allowing users to design and define data pipelines, specifying the flow of data and the required transformations. Organizations can unify data from different environments and clouds and benefit from a data integration tool that combines the simplicity of Microsoft Power Query with the scalability and capabilities of Data Factory.
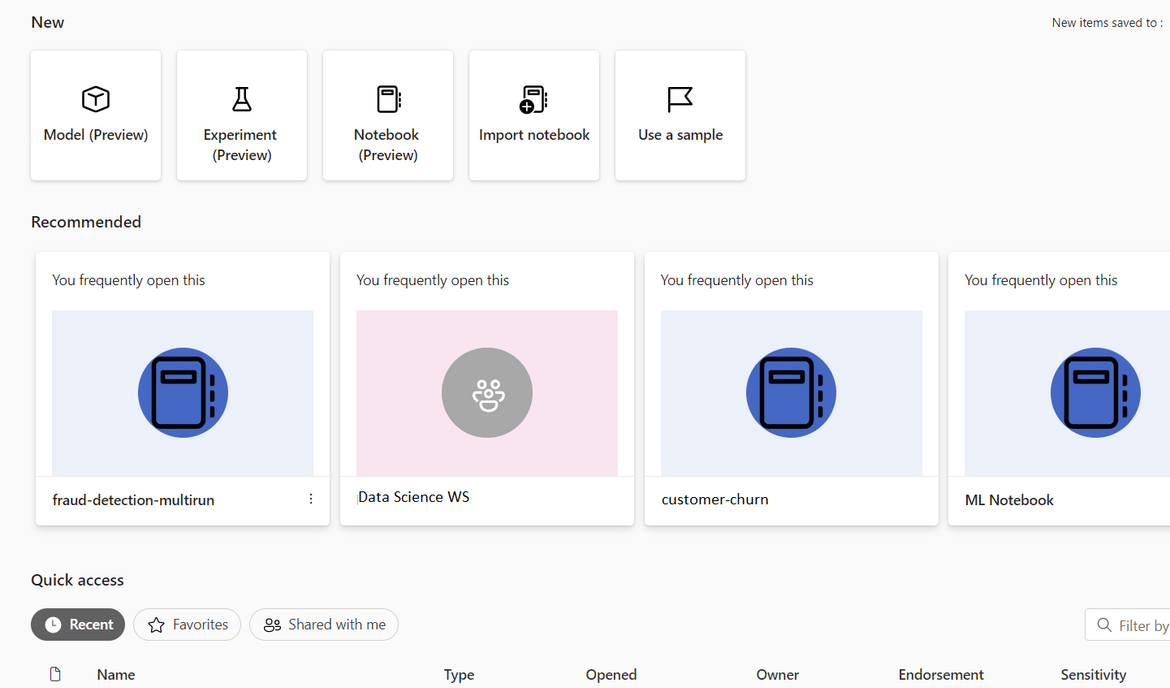
Synapse Data Science (in preview): easily create, use, and share machine learning models for data enrichment and business insights! Microsoft Fabric works with Azure Machine Learning, a powerful data analysis tool, to help data scientists keep track of their experiments and store models securely, allowing them to use their models to make predictions and provide valuable insights. For example, data scientists can create machine learning Experiments, Models, and Notebooks and import existing Notebooks on the Data Science Home page.
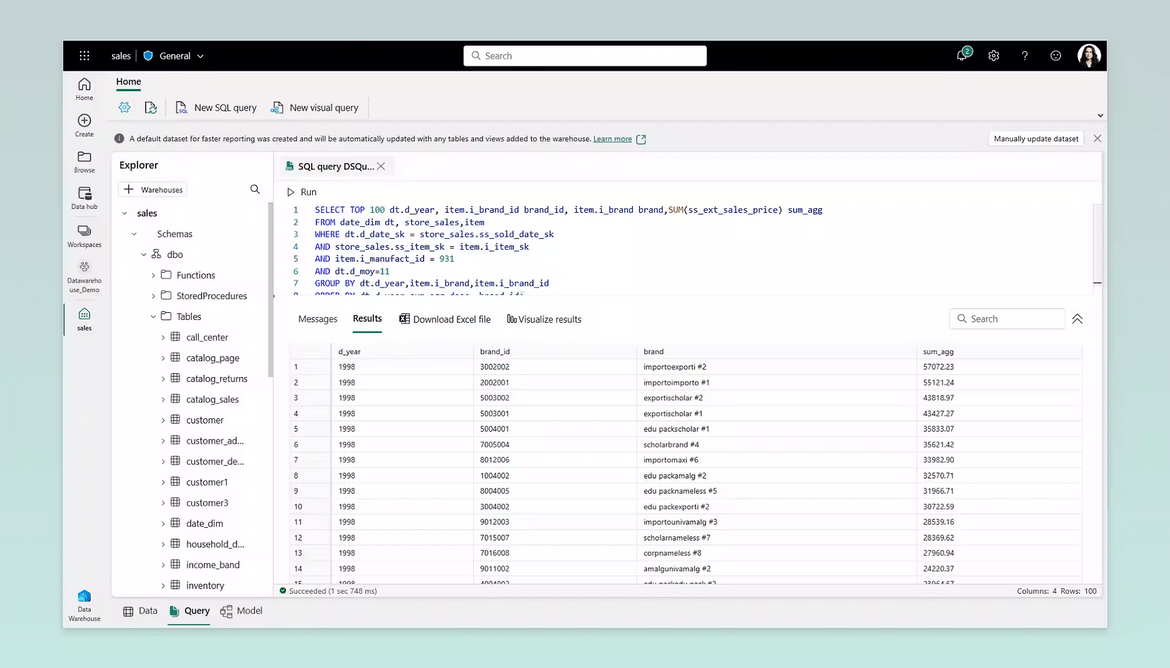
Synapse Data Warehouse (in preview): A data warehouse is a central repository that stores and organizes large amounts of structured, historical data from various sources within an organization enabling efficient analysis, reporting, and decision-making processes.
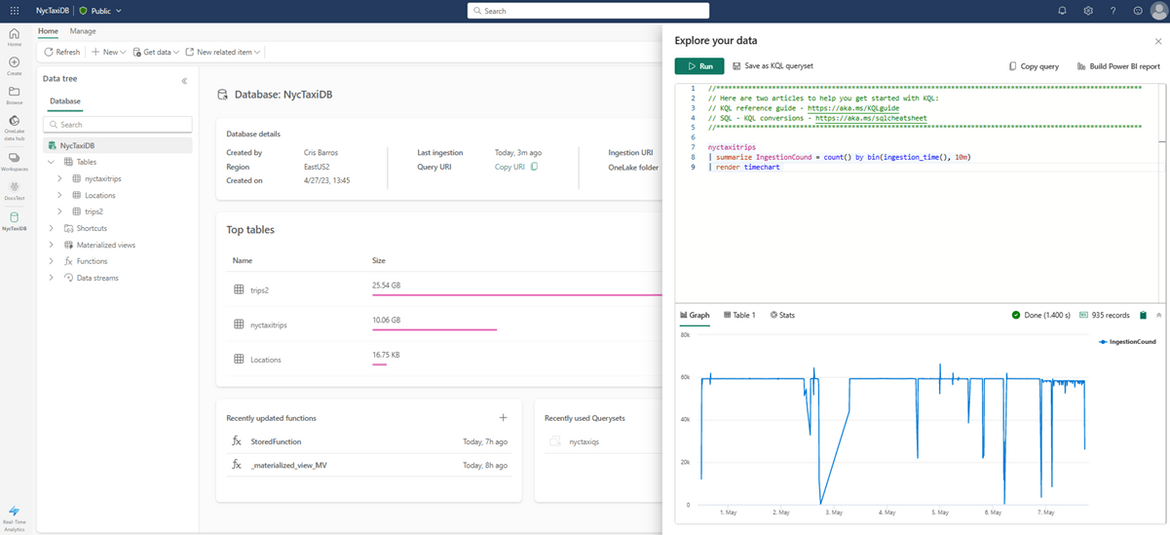
Real-Time Analytics (in preview): Improve products, customer experiences, and business operations through real-time analysis of large volumes of data from apps, websites, and Internet of Things (IoT) devices. Real-time analytics makes data integration easier and simplifies the user process by providing automatic data streaming, indexing, and partitioning. The user process is streamlined so you can focus on your analytics solutions by scaling up seamlessly as your data and queries grow.
Power BI (in preview): As the world’s leading business intelligence platform, Power BI is a collection of software services, apps, and connectors that work together to turn your unrelated sources of data into clear, visually immersive, and interactive insights. Whether your data is on an Excel sheet or stored in a collection of cloud-based and on-premises hybrid data warehouses, Power BI allows you to connect, discover, and share your findings seamlessly.
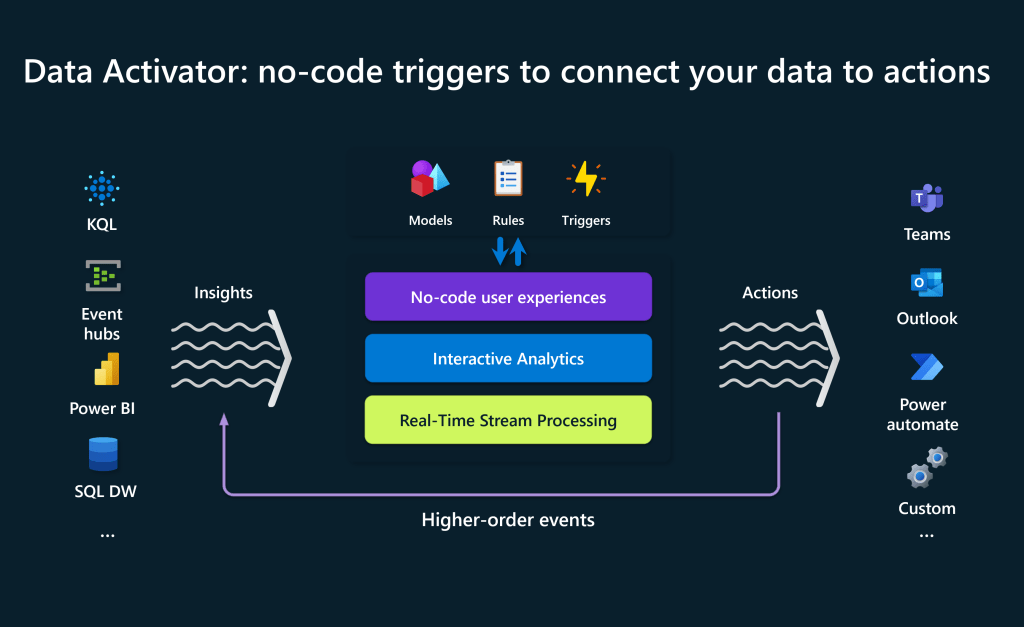
Data Activator (in private preview): a no-code experience empowering business analysts to drive actions automatically from their data. Some examples include:
- Sales: Alert the sales manager if a customer has a past-due balance
- Inventory: Check whether inventory levels are sufficient or need to be notified
- IT Operations: Automatically monitor data and fix it if metrics are below target
- IoT: Automatically create a support ticket if the fridge temp is too high
How Data Activator Works (Microsoft)
If you enjoyed this article, subscribe to our newsletter to be notified of all new Copilot features, security updates, and trending industry topics.
Trusted Tech Team is an accredited Microsoft CSP Direct Bill Partner, carrying multiple Solutions Partner designations and the now-legacy Microsoft Gold Partner competency. Based in Irvine, California, we report trends affecting IT pros everywhere.
If your organization uses Microsoft 365 or Azure, you may be eligible to receive a complimentary savings report from a Trusted Tech Team Licensing Engineer. Click here to schedule a consultation with our team now to learn how much you can save today.
Subscribe to the Trusted Tech Team Blog
Get the latest posts delivered right to your inbox

